Creating a statistical report about CO2 emissions in grams
Last updated: 6 July 2026
In this article
To find out how much carbon dioxide (CO2) emissions your transport is estimated to have, you can use the statistics report CO2 emissions.
About the statistical report CO2 emissions
Exact CO2 emissions for an individual transport depend on actual fuel consumption and specific fuel, what other goods were being transported at the same time, how much empty running the transport caused, etc. It is difficult to obtain exact values for these data, so a standardised figure is used for fuel consumption and the CO2 emission factor. The templates are chosen so that the CO2 emissions data are reliable on average over time.
The statistical report is based on templates. To get it as accurate as possible, you need to find out your actual CO2 emissions, for example by totalling everything refuelled over a period of time. Then try out different factors on services until the sum in the statistics matches the reality and the allocation between different shipments is reasonable.
You can create a statistical report showing the estimated CO2 emissions from transport for a given period. You can choose to create the report:
-
Per vehicle
-
By customer
-
By service
-
By office (Called Total in Opter 2025.06.00 and earlier.)
-
Overview (Available in Opter as of 2025.12.00.)
The statistical report displays the following two columns for CO2 emissions:
-
Estimated (g) is an initial calculation of the order's CO2 emissions. The calculation is based on the information that is available at the time the customer places the order.
-
Calculated (g) is the calculated CO2 emissions for a shipment. The calculated CO2 emissions for a shipment is a more accurate calculation than the estimated CO2 emissions for an order, as this calculation is also based on information about the actual vehicle and distance relating to the shipment.
For more information, see CO2 emissions, overview and This is how Opter calculates CO2 emissions.
Conditions
For Opter to calculate CO2 emissions, the following applies:
-
You must first make the settings described in Settings for CO2 emission calculations.
-
There must be a distance on the order. For more information on how to get distance on orders, see Distances, addresses and maps, overview.
Create a report about CO2 emissions
-
Click on Analysis > Statistics. Open CO2 emissions by clicking on
 .
. -
Choose which statistics you want to view by clicking on Per vehicle, By customer, By service, By office or Overview. If you click on By office, the aggregated statistics for the office are shown.
-
Select Period at the top right of the window.
The date period is based on the order date on the order to which the shipments belong. Sometimes shipments are transported the day after the order date, but the order date is the most useful date for comparing with other statistics.
-
Click on Ok to create the statistical report.
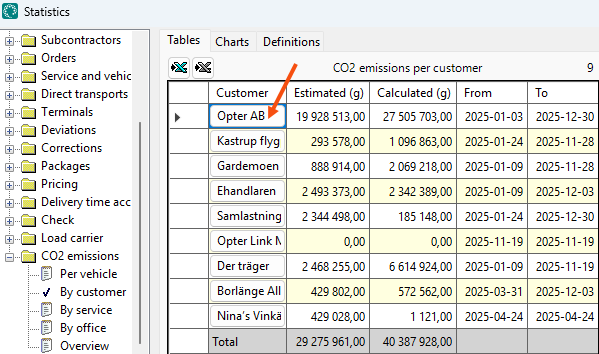
For example, if you selected By customer, the estimated and calculated CO2 emissions for each customer for the period you selected are shown.
-
To display more details, click on one of the customers in the table.
If you selected Per vehicle, you can click on one of the vehicles in the table to see more details. Similarly, it is possible to see more details if you chose By service or By office.
The table displayed may be wider than the window, scroll right to see all the information.
If you want to select a row, click on the leftmost row.
To sort the statistical report in reverse order, click on one of the column headings.
The statistical report also includes the underlying data on which it is based. To work more with the data, it can be exported to Excel by clicking ![]() or
or ![]() . For more information, see Statistical reports.
. For more information, see Statistical reports.
The result
The following points are worth bearing in mind when reviewing the statistical reports on CO2 emissions:
-
Columns Estimated (g) and Calculated (g) show the CO2 emissions figure as it stood at the time of calculation. The calculation is performed each time the order is saved again, so if, for example, you change the vehicle type on an existing order and save it, the Estimated (g) CO2 emissions and Calculated (g) CO2 emissions will be updated. You can also choose to recalculate CO2 emissions for orders in order check and order reception. (For more information, see Recalculate CO2 emissions for orders and This is how Opter calculates CO2 emissions.)
-
Columns Fuel, CO2 emissions (g/km), Fuel CO2e and Emission factor show the current settings in the registers. The values may therefore differ from those that applied when Estimated (g) and Calculated (g) CO2 emissions were calculated for the order and the shipment (for example, if you have changed a vehicle’s fuel consumption since Estimated (g) and Calculated (g) were calculated).
-
The value shown in column Consumption is calculated each time the statistics report is generated. The values may therefore differ from those used when the CO2 emissions for the order and the shipment were calculated in Estimated (g) and Calculated (g) (for example, if you have changed a vehicle’s fuel consumption since the CO2 emissions were calculated in Estimated (g) and Calculated (g)).
-
For column Distance (km), Opter retrieves current distances for the shipments. It may therefore be a different distance from that used when the CO2 emissions in Estimated (g) and Calculated (g) were calculated. For example, if you have manually changed the distance for a shipment after the Calculated (g) CO2 emissions were calculated. Further information on distances can be found in This is how Opter calculates CO2 emissions.
(First, Opter checks whether a distance has been entered manually for the shipment; if so, that distance is used.) If no manual distance has been specified for the shipment, and if the order contains only one shipment, Opter checks whether a distance has been manually entered for the order; if so, that distance is used. Ultimately, the automatically calculated distance is used for the shipment.)
Per vehicle, the result
CO2 emissions per vehicle
The table CO2 emissions per vehicle shows the estimated and calculated CO2 emissions for all vehicles in a given period.
|
Column name |
Description |
|---|---|
|
Vehicles |
Shows for which Vehicle the information in the row applies. You can click on one of the Vehicles in the column to see more details. See table CO2 emissions by shipment below. |
|
Estimated (g) |
Total estimated CO2 emissions of the Vehicle (in grams) during the time period. Opter summarises CO2 emissions as they stood at the time of calculation. (For more information, see section The result above, and in Recalculate CO2 emissions for orders and This is how Opter calculates CO2 emissions.) |
|
Calculated (g) |
Vehicle's total calculated CO2 emissions (in grams) over the time period. Opter summarises CO2 emissions as they stood at the time of calculation. (For more information, see section The result above, and in Recalculate CO2 emissions for orders and This is how Opter calculates CO2 emissions.) |
|
From |
Shows from which date (order date) the information in the row applies. |
|
To |
Shows until which date (order date) the information in the row is valid. |
CO2 emissions by shipment
The table CO2 emissions by shipment appears when you have clicked on one of the Vehicles in the table above. (If you then want to go back and view the table above again, click on Per vehicle on the far left of the window).
|
Column name |
Description |
|---|---|
|
Shipment number |
Shows for which shipment the information in the row applies. |
|
Order |
Shows which order the shipment in the row belongs to. |
|
Estimated (g) |
The order’s estimated CO2 emissions in grams. The column shows the CO2 emissions value as it stood at the time of calculation. (For more information, see section The result above, and in Recalculate CO2 emissions for orders and This is how Opter calculates CO2 emissions.) |
|
Calculated (g) |
Calculated CO2 emissions of the shipment in grams. The column shows the CO2 emissions value as it stood at the time of calculation. (For more information, see section The result above, and in Recalculate CO2 emissions for orders and This is how Opter calculates CO2 emissions.) |
|
Order date |
Order date. |
|
Consignment order no. |
If the shipment in the row belongs to a consignment, the consignment order number is displayed in the column. |
|
Consignment Type |
If the shipment in the row is a consignment shipment, the consignment type is shown. |
|
Service |
Name of the service. |
|
Price vehicle type |
The price vehicle type. |
|
Vehicle type |
The type of vehicle. |
|
Vehicles |
Shows for which Vehicle the information in the row applies. |
|
Suppliers |
If the vehicle belongs to a haulier, the haulier's name is displayed. |
|
Subcontractor |
This column is not used when you have chosen to display statistics for a Vehicle. |
|
Fuel |
The vehicle's fuel. This column shows the current settings in the registers. (Fuel is retrieved first from the vehicle register, secondly from the vehicle type, and thirdly from the price vehicle type.) |
|
Fuel CO2e |
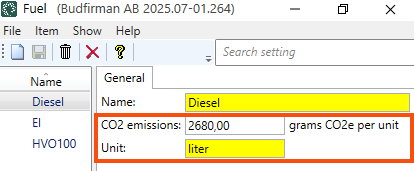
CO2 emissions of the fuel in grams per unit. You can see the unit in the fuel register.
For more information, see Settings for CO2 emission calculations. This column shows the current setting in the fuel register. |
|
Consumption |
Fuel consumption (in litres, for example) for the shipment in question You can see the fuel unit in the fuel register. For more information, see Settings for CO2 emission calculations. The value shown in column Consumption is calculated each time the statistics report is generated. (The values may therefore differ from those that applied when Estimated (g) and Calculated (g) CO2 emissions were calculated for the order/shipment, if, for example, you have changed Fuel consumption (per 100 km) for a vehicle since Estimated (g) and Calculated (g) CO2 emissions were calculated.) |
|
CO2 emissions (g/km) |
Shows CO2 emissions in grams per kilometre. The value shown in column CO2 emissions (g/km) depends on the register in which you have entered a value in the field CO2 emissions (g/km). Opter checks the fields in the registers in the following order:
For more information, see Settings for CO2 emission calculations. The column therefore shows the current setting in the registers (as per the list above). |
|
Emission factor |
The CO2 emission factor of the service, or the price vehicle type under the service. Settings for CO2 emission calculations. The column shows current settings for the service, or the price vehicle type for that service. |
By customer, the result
CO2 emissions per customer
The table CO2 emissions per customer shows the estimated and calculated CO2 emissions for all customers for a given period.
|
Column name |
Description |
|---|---|
|
Customer |
Shows for which customer the information in the row applies. You can click on one of the customers in the column Customer to see more details. (See table CO2 emissions by shipment below).
|
|
Estimated (g) |
The customer's total estimated CO2 emissions (in grams) during the time period. Opter summarises CO2 emissions as they stood at the time of calculation. (For more information, see section The result above, and in Recalculate CO2 emissions for orders and This is how Opter calculates CO2 emissions.) |
|
Calculated (g) |
The customer's total Calculated CO2 emissions (in grams) during the time period. Opter summarises CO2 emissions as they stood at the time of calculation. (For more information, see section The result above, and in Recalculate CO2 emissions for orders and This is how Opter calculates CO2 emissions.) |
|
From |
Shows from which date (order date) the information in the row applies. |
|
To |
Shows until which date (order date) the information in the row is valid. |
CO2 emissions by shipment
The CO2 emissions by shipment table will appear once you have clicked on one of the customers in the table above. (If you then want to go back and view the table above again, click on By customer on the far left of the window).
|
Column name |
Description |
|---|---|
|
Shipment number |
Shows for which shipment the information in the row applies. |
|
Order |
Shows which order the shipment in the row belongs to. |
|
Estimated (g) |
The order’s estimated CO2 emissions in grams. The column shows the CO2 emissions value as it stood at the time of calculation. (For more information, see section The result above, and in Recalculate CO2 emissions for orders and This is how Opter calculates CO2 emissions.) |
|
Calculated (g) |
Calculated CO2 emissions of the shipment in grams. The column shows the CO2 emissions value as it stood at the time of calculation. (For more information, see section The result above, and in Recalculate CO2 emissions for orders and This is how Opter calculates CO2 emissions.) |
|
Order date |
Order date. |
|
Consignment order no. |
If the shipment in the row belongs to a consignment, the consignment order number is displayed in the column. |
|
Consignment Type |
If the shipment in the row is a consignment shipment, the consignment type is shown. |
|
Service |
Name of the service. |
|
Price vehicle type |
The price vehicle type. |
|
Vehicle type |
The type of vehicle. |
|
Vehicles |
Shows for which Vehicle the information in the row applies. |
|
Suppliers |
If the vehicle belongs to a haulier, the haulier's name is displayed. |
|
Subcontractor |
If the shipment on the line has been carried out by a subcontractor, the name of the subcontractor is displayed. |
|
Fuel |
The vehicle's fuel. This column shows the current settings in the registers. (Fuel is retrieved first from the vehicle register, secondly from the vehicle type, and thirdly from the price vehicle type.) |
|
Fuel CO2e |
CO2 emissions of the fuel in grams per unit. You can see the unit in the fuel register.
For more information, see Settings for CO2 emission calculations. This column shows the current setting in the fuel register. |
|
Consumption |
Fuel consumption (in litres, for example) for the shipment in question You can see the fuel unit in the fuel register. For more information, see Settings for CO2 emission calculations. The value shown in column Consumption is calculated each time the statistics report is generated. (The values may therefore differ from those that applied when Estimated (g) and Calculated (g) CO2 emissions were calculated for the order/shipment, if, for example, you have changed Fuel consumption (per 100 km) for a vehicle since Estimated (g) and Calculated (g) CO2 emissions were calculated.) |
|
CO2 emissions (g/km) |
Shows CO2 emissions in grams per kilometre. The value shown in column CO2 emissions (g/km) depends on the register in which you have entered a value in the field CO2 emissions (g/km). Opter checks the fields in the registers in the following order:
For more information, see Settings for CO2 emission calculations. The column therefore shows the current setting in the registers (as per the list above). |
|
Emission factor |
The CO2 emission factor of the service, or the price vehicle type under the service. Settings for CO2 emission calculations. The column shows current settings for the service, or the price vehicle type for the service. |
By service, the result
CO2 emissions per service
The table CO2 emissions per service shows the estimated and calculated CO2 emissions for all services for a given period.
|
Column name |
Description |
|---|---|
|
Service (name) |
Shows for which service the information in the row applies. You can click on one of the services in the column to see more details. See table CO2 emissions by shipment below. |
|
Estimated (g) |
Total estimated CO2 emissions (in grams) of the service during the time period. Opter summarises CO2 emissions as they stood at the time of calculation. (For more information, see section The result above, and in Recalculate CO2 emissions for orders and This is how Opter calculates CO2 emissions.) |
|
Calculated (g) |
Total Calculated CO2 emissions (in grams) of the service during the time period. Opter summarises CO2 emissions as they stood at the time of calculation. (For more information, see section The result above, and in Recalculate CO2 emissions for orders and This is how Opter calculates CO2 emissions.) |
|
From |
Shows from which date (order date) the information in the row applies. |
|
To |
Shows until which date (order date) the information in the row is valid. |
CO2 emissions by shipment
The table CO2 emissions by shipment appears after clicking on one of the services in the table above. (If you then want to go back and view the table above again, click on By service on the far left of the window).
|
Column name |
Description |
|---|---|
|
Shipment number |
Shows for which shipment the information in the row applies. |
|
Order |
Shows which order the shipment in the row belongs to. |
|
Estimated (g) |
The order’s estimated CO2 emissions in grams. The column shows the CO2 emissions value as it stood at the time of calculation. (For more information, see section The result above, and in Recalculate CO2 emissions for orders and This is how Opter calculates CO2 emissions.) |
|
Calculated (g) |
Calculated CO2 emissions of the shipment in grams. The column shows the CO2 emissions value as it stood at the time of calculation. (For more information, see section The result above, and in Recalculate CO2 emissions for orders and This is how Opter calculates CO2 emissions.) |
|
Order date |
Order date. |
|
Consignment order no. |
If the shipment in the row belongs to a consignment, the consignment order number is displayed in the column. |
|
Consignment Type |
If the shipment in the row is a consignment shipment, the consignment type is shown. |
|
Service |
Name of the service. |
|
Price vehicle type |
The price vehicle type. |
|
Vehicle type |
The type of vehicle. |
|
Vehicles |
Shows for which Vehicle the information in the row applies. |
|
Suppliers |
If the vehicle belongs to a haulier, the haulier's name is displayed. |
|
Subcontractor |
If the shipment on the line has been carried out by a subcontractor, the name of the subcontractor is displayed. |
|
Fuel |
The vehicle's fuel. This column shows the current settings in the registers. (Fuel is retrieved first from the vehicle register, secondly from the vehicle type, and thirdly from the price vehicle type.) |
|
Fuel CO2e |
CO2 emissions of the fuel in grams per unit. You can see the unit in the fuel register.
For more information, see Settings for CO2 emission calculations. This column shows the current setting in the fuel register. |
|
Consumption |
Fuel consumption (in litres, for example) for the shipment in question You can see the fuel unit in the fuel register. For more information, see Settings for CO2 emission calculations. The value shown in column Consumption is calculated each time the statistics report is generated. (The values may therefore differ from those that applied when Estimated (g) and Calculated (g) CO2 emissions were calculated for the order/shipment, if, for example, you have changed Fuel consumption (per 100 km) for a vehicle since Estimated (g) and Calculated (g) CO2 emissions were calculated.) |
|
CO2 emissions (g/km) |
Shows CO2 emissions in grams per kilometre. The value shown in column CO2 emissions (g/km) depends on the register in which you have entered a value in the field CO2 emissions (g/km). Opter checks the fields in the registers in the following order:
For more information, see Settings for CO2 emission calculations. The column therefore shows the current setting in the registers (as per the list above). |
|
Emission factor |
The CO2 emission factor of the service, or the price vehicle type under the service. Settings for CO2 emission calculations. The column shows current settings for the service, or the price vehicle type for that service. |
By office, the result
(This statistical report is called Total in Opter 2025.06.00 and earlier.)
CO2 emissions per office
The table CO2 emissions per office shows the estimated and calculated CO2 emissions for all offices for a given period.
|
Column name |
Description |
|---|---|
|
Office |
Shows for which office the information in the row applies. You can click on one of the offices in the column to see more details. See table CO2 emissions by shipment below. |
|
Estimated (g) |
The office's total estimated CO2 emissions (in grams) over the period. Opter summarises CO2 emissions as they stood at the time of calculation. (For more information, see section The result above, and in Recalculate CO2 emissions for orders and This is how Opter calculates CO2 emissions.) |
|
Calculated (g) |
The total calculated CO2 emissions (in grams) of the office over the period. Opter summarises CO2 emissions as they stood at the time of calculation. (For more information, see section The result above, and in Recalculate CO2 emissions for orders and This is how Opter calculates CO2 emissions.) |
|
From |
Shows from which date (order date) the information in the row applies. |
|
To |
Shows until which date (order date) the information in the row is valid. |
CO2 emissions by shipment
The CO2 emissions by shipment table will appear once you have clicked on one of the offices in the table above. (If you then want to go back and view the table above again, click on By office on the far left of the window).
|
Column name |
Description |
|---|---|
|
Shipment number |
Shows for which shipment the information in the row applies. |
|
Order |
Shows which order the shipment in the row belongs to. |
|
Estimated (g) |
The order’s estimated CO2 emissions in grams. The column shows the CO2 emissions value as it stood at the time of calculation. (For more information, see section The result above, and in Recalculate CO2 emissions for orders and This is how Opter calculates CO2 emissions.) |
|
Calculated (g) |
Calculated CO2 emissions of the shipment in grams. The column shows the CO2 emissions value as it stood at the time of calculation. (For more information, see section The result above, and in Recalculate CO2 emissions for orders and This is how Opter calculates CO2 emissions.) |
|
Order date |
Order date. |
|
Consignment order no. |
If the shipment in the row belongs to a consignment, the consignment order number is displayed in the column. |
|
Consignment Type |
If the shipment in the row is a consignment shipment, the consignment type is shown. |
|
Service |
Name of the service. |
|
Price vehicle type |
The price vehicle type. |
|
Vehicle type |
The type of vehicle. |
|
Vehicles |
Shows for which Vehicle the information in the row applies. |
|
Suppliers |
If the vehicle belongs to a haulier, the haulier's name is displayed. |
|
Subcontractor |
If the shipment on the line has been carried out by a subcontractor, the name of the subcontractor is displayed. |
|
Fuel |
The vehicle's fuel. This column shows the current settings in the registers. (Fuel is retrieved first from the vehicle register, secondly from the vehicle type, and thirdly from the price vehicle type.) |
|
Fuel CO2e |
CO2 emissions of the fuel in grams per unit. You can see the unit in the fuel register.
For more information, see Settings for CO2 emission calculations. This column shows the current setting in the fuel register. |
|
Consumption |
Fuel consumption (in litres, for example) for the shipment in question You can see the fuel unit in the fuel register. For more information, see Settings for CO2 emission calculations. The value shown in column Consumption is calculated each time the statistics report is generated. (The values may therefore differ from those that applied when Estimated (g) and Calculated (g) CO2 emissions were calculated for the order/shipment, if, for example, you have changed Fuel consumption (per 100 km) for a vehicle since Estimated (g) and Calculated (g) CO2 emissions were calculated.) |
|
CO2 emissions (g/km) |
Shows CO2 emissions in grams per kilometre. The value shown in column CO2 emissions (g/km) depends on the register in which you have entered a value in the field CO2 emissions (g/km). Opter checks the fields in the registers in the following order:
For more information, see Settings for CO2 emission calculations. The column therefore shows the current setting in the registers (as per the list above). |
|
Emission factor |
The CO2 emission factor of the service, or the price vehicle type under the service. Settings for CO2 emission calculations. The column shows current settings for the service, or the price vehicle type for that service. |
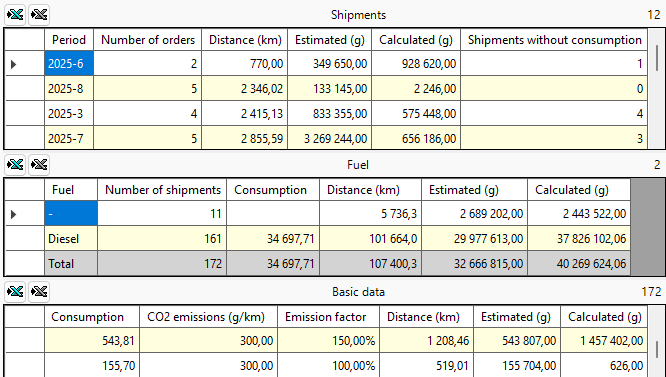
Overview, the result
Overview available in Opter as of 2025.12.00.
The total shown at the bottom of column Estimated (g) may differ across the three tables for the following reasons:
-
The estimated CO2 emissions are an initial calculation of the order’s CO2 emissions.
-
Table Shipments summarises the data by order. The estimated CO2 emissions for each order are calculated once.
-
Table Fuel summarises the data by order and by fuel type. If, for example, an order comprises two shipments that use different types of fuel, the order’s estimated CO2 emissions will be calculated twice, i.e. once for each type of fuel.
-
Table Basic data summarises the data by shipment. If, for example, an order comprises three shipments, the order’s estimated CO2 emissions will be calculated three times, i.e. once per shipment.
Shipments
The table Shipments shows estimated and calculated CO2 emissions per day, week or month.
The table also shows how many shipments have no fuel consumption. The CO2 emissions of these shipments are therefore unknown and therefore not included in the column Calculated (g).
|
Column name |
Description |
|---|---|
|
Period |
Shows for which time period the information in the row applies. If you chose Time scale:
|
|
Number of orders |
Shows the number of orders. |
|
Distance (km) |
The totalled distances for all shipments during the period. The distance is shown in kilometres. Opter retrieves current distances for the shipments and adds them together. It may therefore be a different distance from the one used when the CO2 emissions in Estimated (g) and Calculated (g) were calculated. Further information on distances can be found in section The result above and in This is how Opter calculates CO2 emissions. |
|
Estimated (g) |
The total estimated CO2 emissions (in grams) over the period. Opter summarises CO2 emissions as they stood at the time of calculation. (For more information, see section The result above, and in Recalculate CO2 emissions for orders and This is how Opter calculates CO2 emissions.) |
|
Calculated (g) |
Total Calculated CO2 emissions (in grams) over the time period. Opter summarises CO2 emissions as they stood at the time of calculation. (For more information, see section The result above, and in Recalculate CO2 emissions for orders and This is how Opter calculates CO2 emissions.) |
|
Shipments without consumption |
Shows how many shipments have no fuel consumption and therefore CO2 emissions. The CO2 emissions of these shipments are therefore unknown and therefore not included in the column Calculated (g). If you want to find out the reason why these shipments are missing fuel consumption, see FAQs and troubleshooting, CO2 emissions or Settings for CO2 emission calculations. |
Fuel
Table Fuel shows estimated and calculated CO2 emissions and fuel consumption for the various fuels used over a specific period.
|
Column name |
Description |
|---|---|
|
Fuel |
Shows which fuel the information in the row applies to. |
|
Number of shipments |
Shows the number of shipments to which the information in the row applies. |
|
Consumption |
Fuel consumption (in litres, for example) for the fuel(s) in the row. You can see the fuel unit in the fuel register. For more information, see Settings for CO2 emission calculations. The value shown in column Consumption is calculated each time the statistics report is generated. (The values may therefore differ from those that applied when Estimated (g) and Calculated (g) CO2 emissions were calculated for the order/shipment, if, for example, you have changed Fuel consumption (per 100 km) for a vehicle since Estimated (g) and Calculated (g) CO2 emissions were calculated.) |
|
Distance (km) |
The totalled distances for all shipments using the fuel/fuel shown in the column Fuel. The distance is shown in kilometres. Opter retrieves current distances for the shipments and adds them together. It may therefore be a different distance from the one used when the CO2 emissions in Estimated (g) and Calculated (g) were calculated. Further information on distances can be found in section The result above and in This is how Opter calculates CO2 emissions. |
|
Estimated (g) |
The total estimated CO2 emissions (in grams) for all orders that used the fuel/fuelling shown in the column Fuel. Opter summarises CO2 emissions as they stood at the time of calculation. (For more information, see section The result above, and in Recalculate CO2 emissions for orders and This is how Opter calculates CO2 emissions.) |
|
Calculated (g) |
The total Calculated CO2 emissions (in grams) for all shipments that used the fuel/fuelling shown in the column Fuel. Opter summarises CO2 emissions as they stood at the time of calculation. (For more information, see section The result above, and in Recalculate CO2 emissions for orders and This is how Opter calculates CO2 emissions.) |
Basic data
The table Basic data shows the basic data on which the statistical report (i.e. the tables above) is based.
|
Column name |
Description |
|---|---|
|
Order number |
Shows for which order the information in the row applies. |
|
Shipment number |
Shows for which shipment the information in the row applies. |
|
Consignment order no. |
If the shipment in the row belongs to a consignment, the consignment order number is displayed in the column. |
|
Consignment Type |
If the shipment in the row is a consignment shipment, the consignment type is shown. |
|
Order date |
Order date. |
|
Service |
Name of the service. |
|
Price vehicle type |
The price vehicle type. |
|
Vehicle type |
The type of vehicle. |
|
Vehicles |
Shows which Vehicle has performed the shipment to which the row applies. |
|
Suppliers |
If the vehicle that carried out the shipment belongs to a haulier, the haulier's name is displayed. |
|
Subcontractor |
If the shipment on the line has been carried out by a subcontractor, the name of the subcontractor is displayed. |
|
Fuel |
The vehicle's fuel. This column shows the current settings in the registers. (Fuel is retrieved first from the vehicle register, secondly from the vehicle type, and thirdly from the price vehicle type.) |
|
Fuel CO2e |
CO2 emissions of the fuel in grams per unit. You can see the unit in the fuel register.
For more information, see Settings for CO2 emission calculations. The column shows the current setting in the fuel register. |
|
Consumption |
Fuel consumption (in litres, for example) for the shipment in question You can see the fuel unit in the fuel register. For more information, see Settings for CO2 emission calculations. The value shown in column Consumption is calculated each time the statistics report is generated. (The values may therefore differ from those that applied when Estimated (g) and Calculated (g) CO2 emissions were calculated for the order/shipment, if, for example, you have changed Fuel consumption (per 100 km) for a vehicle since Estimated (g) and Calculated (g) CO2 emissions were calculated.) |
|
CO2 emissions (g/km) |
Shows CO2 emissions in grams per kilometre. The value shown in column CO2 emissions (g/km) depends on the register in which you have entered a value in the field CO2 emissions (g/km). Opter checks the fields in the registers in the following order:
For more information, see Settings for CO2 emission calculations. The column therefore shows the current setting in the registers (as per the list above). |
|
Emission factor |
The CO2 emission factor of the service, or the price vehicle type under the service. Settings for CO2 emission calculations. The column shows current settings for the service, or the price vehicle type for that service. |
|
Distance (km) |
Distance of the shipment in kilometres. Opter retrieves the current distance for the shipment. It may therefore be a different distance from the one used when the CO2 emissions in Estimated (g) and Calculated (g) were calculated. Further information on distances can be found in section The result above and in This is how Opter calculates CO2 emissions. |
|
Estimated (g) |
The order’s estimated CO2 emissions in grams. The column shows the CO2 emissions value as it stood at the time of calculation. (For more information, see section The result above, and in Recalculate CO2 emissions for orders and This is how Opter calculates CO2 emissions.) If you want to see the values used to calculate the estimated CO2 emissions of the order, you can open the order in the Order reception and hover over the field Estimated CO2 emissions (g) in the section Data. For more information, see View CO2 emissions in Opter and FAQs and troubleshooting, CO2 emissions. If the text The emission values have changed. To list the emissions components, the CO2 value needs to be recalculated. appears when you hover the mouse pointer over the field, see Recalculate CO2 emissions for orders. |
|
Calculated (g) |
Calculated CO2 emissions of the shipment in grams. The column shows the CO2 emissions value as it stood at the time of calculation. (For more information, see section The result above, and in Recalculate CO2 emissions for orders and This is how Opter calculates CO2 emissions.) If you want to see the values used to calculate the CO2 emissions of the shipment, you can open the order in the Order reception and hover over the field CO2 emissions, calculated (g) on the order in the Order reception. (Expand Details, you will find the field CO2 emissions, calculated (g) on the tab General). For more information, see View CO2 emissions in Opter and FAQs and troubleshooting, CO2 emissions. If the text The emission values have changed. To list the emissions components, the CO2 value needs to be recalculated. appears when you hover the mouse pointer over the field, see Recalculate CO2 emissions for orders. |
Troubleshooting
If the statistical reports do not make sense:
-
See Conditions above.
-
Please note that some columns show the current setting in the registers, whilst other columns show values that are calculated each time the statistics report is generated. In addition, certain columns show the value as it stood when the CO2 emissions for the order/shipment were calculated. See section For more information, see The result and the column descriptions above.
-
Troubleshooting tips can be found at FAQs and troubleshooting, CO2 emissions.