Retrieving statistical data via API
Last updated: 9 October 2025
In this article
Statistical reports can be created in the following different ways:
-
Use Opter's statistics API to get any statistical data from Opter and then create statistical reports outside Opter.
You can programme a solution where you call Opter's statistics API and then receive the results and present the statistics as desired. The flow can be automated so that the desired statistical information is retrieved from Opter as often as desired. For example, if the statistics are to be presented on a dashboard, you may want to retrieve statistics once every hour.
-
Manually take out a statistical report when you wish. For more information, see Statistical reports.
The statistics API works like this
-
Using the statistics API, it is possible to retrieve data/information related to transport orders that is contained in Opter, such as delivery time accuracy. The information returned by the statistics API is the "raw data"/basic data from the database in Opter.
-
The user of the statistics API needs an API key (see Step 2: Create an API key below).
-
When you call the API, you get back all the data you chose to retrieve in the same call. (The statistical data is not divided into smaller parts, no paging takes place).
-
When you call the API, you get the data back as it is at that exact moment in the database in Opter.
-
You can retrieve data as often as you like. However, we recommend that you do not retrieve it more often than is necessary for the intended purpose.
-
When calling the API, it is mandatory to specify for which period you want the statistics(dateFrom and dateTo) and which date type the statistics should be based on(dateType). For more information, see the table Selecting the type of date the statistics data should be based on below.
Step 1: Plan
The steps below provide instructions on how to use the statistics API, but we recommend doing the following first:
-
Decide what you want to achieve, i.e. what do you want to get out and why.
-
Decide how often the statistical data shall be retrieved from Opter.
For example, if the statistics are to be presented on a dashboard, you may want to retrieve the statistical data every hour. If you want to use the statistics for a follow-up at the end of each day, you can download the statistical data at the end of each day.
-
Decide who will have access to the statistics API. Anyone who accesses the statistics API will have access to all the data, including information on customers, prices, invoices, etc.
-
If you have any questions, contact the EDI team at .
-
If you want to download statistical data on CO2 emissions, see Retrieve statistical data via API, CO2 emissions in grams.
Step 2: Create an API key
Anyone who accesses the statistics API will have access to all the data, including information on customers, prices, invoices, etc. There is no way to limit access (for example, to exclude information about prices).
The user of the statistics API needs to have an API key. Proceed as follows:
-
Click on Settings > API access (and the General tab).
-
To create a new user, click on
 and enter Name.
The API key field displays the API key that has been created.
-
In the Description field, describe to what the user shall have access.
-
Click on the Access tab.
-
Double-click on Statistics in the Excluded list and Statistics will be moved to the Included list.
This means that the user can access all the statistical data in Opter via the statistics API using the API key.
-
Click on Save to save all changes.
Step 3: Go to the swagger documentation
-
The swagger documentation for the statistics API is at the same URL as the customer web, but with "/api" at the end:
-
If you are running Opter Cloud:
https://<your company name><country>.opter.cloud/api/index.html
Example: If your company name in Opter is "courier services" and the country is Sweden, use https://courierservicesse.opter.cloud/api/index.html
-
If you have your own server:
https://<your company name or IP address>.<country>/api/index.html
Example: If your company name in Opter is "courier services" and the country is Sweden, use
“https://courierservices.se/api/index.html or https://123.45.678.901/api/index.html”
If you cannot find the swagger documentation for the statistics API, please contact the EDI team at .
-
-
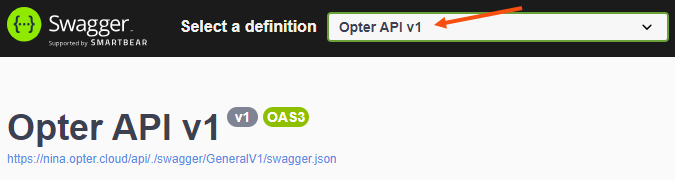
The drop-down menu is located in the top-right corner of the webpage Select a definition. Select "Opter API v1".
Using the data model
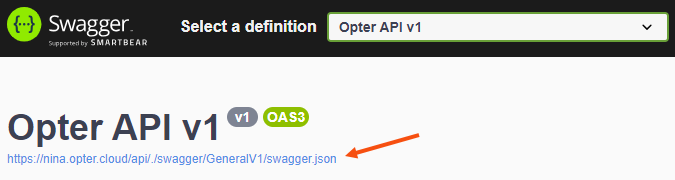
To import the API into a tool such as Postman, the data model for the API is at the top of the swagger website.
Try using the API
If you want to test using the API, this can be done on the swagger website or by using a test program such as Postman.
To try calling the statistics API on the swagger website and see the results, proceed as follows:
-
In the top right-hand corner of the website is the Select a definition drop-down list. Select "Opter API v1" from the drop-down list.
-
Click on Authorise. Copy the API key from the API access window in Opter, paste it into the Value field and click Authorise. Now it says Authorised in the window. Click on Close.
(You created the API key in Step 2: Create an API key above).
-
Scroll down to Statistics and click on GET.
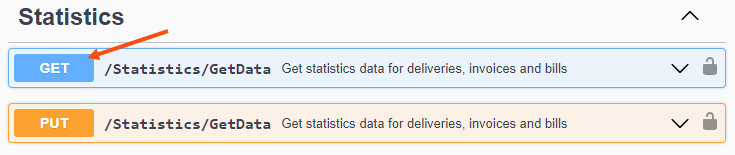
All the parameters ("queries") are displayed.
-
Click on the Try it out button.
-
Select dateType (mandatory) from the drop-down list. What the different choices mean is shown in the table Select the type of date on which to base the statistical data below.
-
Select the period for which you want the statistical data by choosing dateFrom (mandatory) and dateTo (mandatory).
Dates are written in the format "yyyy-mm-dd", for example "2024-08-19". To enter both the date and the time, type a space between the date and the time, for example "2024-08-19 13:30".
If only the date is entered, the default time of 00:00 is used.
-
Choose which statistical data you want by selecting "true" for those parameters in the drop-down list.
For example, if you set includeDeliveries to "true", all data about orders will be retrieved, and all data about scans will be retrieved if you set includeScans to "true".
(The default setting is "false", which means "true" only needs to be selected for the parameters that are to be included in the statistical data).
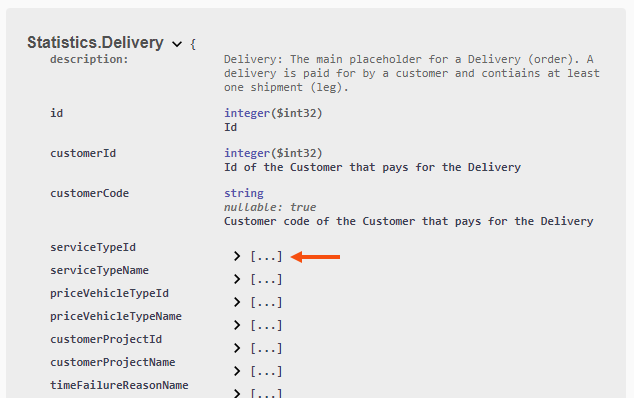
Details of what data is retrieved if you select "true" for includeDeliveries and includeScans, for example, are shown further down the swagger documentation under Schemas. Click on Statistics.Delivery and Statistics.Scan. Click on "[...]" to see more details.
-
In the API version field, you can choose to enter a specific version or leave the field blank if you want the latest version of the API to be used. To use a specific version, type for example "1.0" in the field.
-
Click the Execute button to send the API call. Under Responses the result is displayed.
Under Server response, the result/response is displayed in JSON format. Click on the Download button to download the JSON file.
If you want to test the same API call in, for example, the Postman tool, you can copy the API call shown in the Curl code window.
-
If you want to test again (for example, with different parameters), click Clear next to Execute to clear under Responses. You can then re-call the API by pressing Execute and look at the result.
Select the type of date on which to base the statistical data
When you call the statistics API, you use the parameters dateFrom (from date and time) and dateTo (to date and time) to select the period for which the statistics data should be retrieved.
You use the dateType parameter to select the type of date on which the statistical data will be based, as shown in the table below.
|
dateType |
Description |
|---|---|
|
TransportDate |
Based on orders where Order date matches the date period. All the information about those orders can be included, including invoices, scans, etc. that are outside the date period. |
|
ScanDate |
Based on scan rows (package scans or freight bill scans). All the information about the orders that have scans in the selected period can be included, regardless of the order date of the orders, the invoice date of the invoices, etc. Invoices and supplier bills will not necessarily be complete, only those orders that have scans in the period will be included. In the dateFrom and dateTo parameters, it may be relevant to specify both date and time. See example below. |
|
InvoiceDate |
Based on invoices where the invoice date matches the date period. All the information on orders in the invoices can be included. This applies even if there is just additional invoicing on the order (a new price item or a correction, for example). Orders that are not on an invoice matching the period will not be included, regardless of the order date, scan date, etc. |
|
BillDate |
Based on supplier bills where the crediting date matches the date period in the same way as above. |
|
Retrieves data about which orders have changed during the period. This applies not only to changes made by opening the order, making changes and then saving it. It also applies to changes made in dispatch and apps, for example:
In the dateFrom and dateTo parameters, it may be relevant to specify both date and time. See example below. For an order that has been changed during the period, the date and time when the order was last changed (during the period) is displayed. A bit more information about changes to the orders can be seen by looking at the logs in the Order log box in order reception in Opter. |
Consider the following
-
There is no history that can be followed on the order. When the API is called, the data as it is at that exact moment in Opter is returned.
However, it is possible to get statistics on which orders have been changed during a certain period, see ChangeDate above. The statistics do not show what has been changed, only the date and time the order was last changed.
A bit more information about changes to the orders can be seen by looking at the logs in the Order log box in order reception in Opter.
-
Opter provides the statistics API, but you are responsible for how the results/responses of the API calls are handled and analysed. Opter does not provide tools for that.
Example
Statistics on which orders have been changed
If you want to retrieve data on the following:
-
Which orders have changed during a certain date period, for example during the month December 2024. Enter the date period in the parameters dateFrom "2024-12-01" and dateTo "2025-01-01". If only the date is entered, the default time of 00:00 is used.
-
Which orders have changed since a certain date, up to and including so far today, for example, from "2024-07-22" to today's date and current time. Enter the date in the dateFrom parameter "2024-07-22", and the date and time in the dateTo parameter "2024-07-26 13:30" (today's date and current time).
If you do not specify a time, the default time of 00:00 is used. This means that if you only enter (today's) date in dateTo, you will not see which orders have changed today.
-
Which orders have changed in the last 10 minutes.
For example, if the time is 10:20 and the date is 2024-07-26, you enter today's date and the time that was 10 minutes ago in the dateFrom parameter "2024-07-26 10:10", and today's date and the current time in the dateTo parameter "2024-07-26 10:20".
Select "ChangeDate" from the dateType drop-down list (For more information, see table above, ChangeDate.)
Select 'true' in the includeDeliveries drop-down list.
Details of what data is retrieved if you select "true" for includeDeliveries are shown further down the swagger documentation under Schemas. Click on Statistics.Delivery and then on "[...]" to see more details. For orders that have changed during the period:
-
“id” shows the order number.
-
"customerCode" shows the customer code.
-
"created" shows the date and time when the order was created.
-
"changed" shows the date and time when the order was last changed.
Troubleshooting
-
If you cannot find the statistics API in the swagger documentation, check that you have selected "Opter API v1" in the drop-down menu in the top right corner of the web page in the Select a definition drop-down menu. See the image above.
-
If the API key does not work, a new can be created one in the API access window on the General tab at the API key field. To create a new API key, click on New key and then on
 to save it. It can then be used to access the statistics API.
 -
If you have any questions or need help with troubleshooting, please contact the EDI team at .