Creating a statistical report about scanned packages
Last updated: 14 December 2023
In this article
A statistical report showing the last 10 scans for all the packages in a given period can be created. It is possible to choose to have the report for package scans performed for a specific terminal or all terminals, and for a specific customer or all customers.
The statistical report shows the order number, customer code, customer name, freight bill number, order date, sender's name, receiver's name, receiver's postcode and postal town, package number, type of goods, name on the proof of delivery, time when the proof of delivery was created, and the from terminal (if the starting address was a terminal).
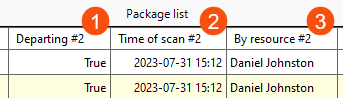
By scrolling to the right, the 10 most recent scans are displayed for each package, using three columns (1) (2) (3) for each scan. The columns are shown in the image below and are repeated for each scan.
-
Departing #1 (1) returns “True” if a departure scan has been performed, and “False” if an arrival scan or floor check scan has been performed.
-
Time of scan (2) shows the date and time the scan was performed.
-
By resource (3) shows which resource was logged into Opter Terminal or Opter Driver when the scan was performed.
(If the scan was registered in the Scanning test window in Opter, the resource entered by the logged-in user is displayed in the Scanning test window).
The number after the column name indicates the sequence number of the scan, in the image above it is scan number 2. To see the latest scan for a package, scroll to the far right. The scan with the highest sequence number is the most recent scan performed on the package. The column number can be seen by scrolling to the left.
Creating a report about scanned packages
-
Click on Analysis > Statistics. Open Packages by clicking on
 .
. -
Click on Scanned packages.
-
Select Period to the right of the window.
The date period is based on the order date on the shipment’s order. Sometimes shipments are delivered the day after the order date, but the order date is primarily useful if you want to do a comparison with other statistics.
-
Select Terminal to the right of the window. It is possible to choose to create the statistical report about package scans for a specific terminal or all terminals.
-
To obtain the statistical report for a specific customer, enter the customer code in the Customer field on the right-hand side of the window.
To obtain the statistical report for all customers, leave the Customer field empty.
-
Click on Ok to create the statistical report.
-
The statistical report also includes the underlying data on which it is based. To work more with the data, it can be exported to Excel by clicking
 or
or  .
.