Create a statistical report on utilisation rates
Last updated: 6 November 2025
Valid from Opter 2025.12.00.
In this article
About the statistical report Load factor
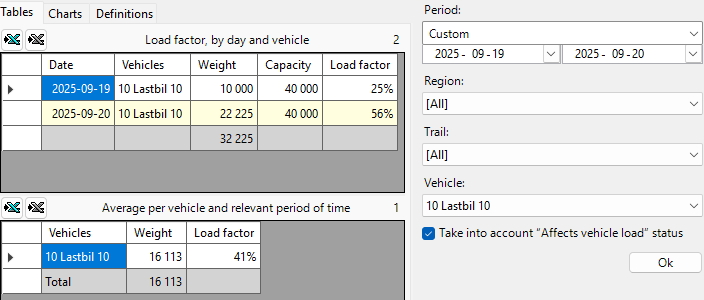
The statistical report Load factor gives an overview of how well the capacity of vehicles has been utilised over a selected period of time. It shows the load factor per vehicle per day, and the average load factor for the selected period. The aim is to provide operations with a simple basis for monitoring capacity utilisation and identifying patterns in line haul and similar flows.
Fill rate is a complex concept, especially when consignments and goods loaded and unloaded during the journey are taken into account. The statistical report is therefore not intended to be comprehensive, but should be seen as a support for summary analysis suitable for certain use cases.
A good application could be, for example, when you want to see the load factor of vehicles in line haul where goods are loaded and unloaded during the same day.
Create the statistical report
In order to obtain the most accurate statistical report possible, see Prerequisites below.
Proceed as follows:
-
Click on Analysis > Statistics. Open Vehicles by clicking on
 .
. -
Click on Load factor.
-
On the right side of the window, select whether you want to create the statistics report for a particular:
-
Period.
In the first instance, the order date is used as the loading date, and in the second instance the order date is used.
-
Region.
-
Trail.
-
Vehicle.
-
-
Checkbox Take into account “Affects vehicle load” status:
 : Only count shipments that are in status where the checkbox Affects vehicle load is ticked.
 : Expect shipments in all different statuses.
For more information, see Conditions below.
-
Click on Ok to create the statistical report.
-
The statistical report also includes the underlying data on which it is based. To work more with the data, it can be exported to Excel by clicking
 or
or  . For more information, see Statistical reports.
The statistical report, the result
Load factor, by day and vehicle
For example, the table Load factor, by day and vehicle may show that a particular vehicle was loaded to 85% of its maximum capacity on a particular day.
The columns of the table are described below.
|
Column name |
Description |
|---|---|
|
Date |
Indicates the date to which the information in the row applies. |
|
Vehicles |
Indicates to which Vehicle the information in the row applies. |
|
Weight |
The summed pricing weight from all shipments that fulfil the conditions you specified when creating the statistical report, i.e. period, region, trail, vehicle and the setting of the checkbox Take into account “Affects vehicle load” status. |
|
Capacity (weight) |
Displays the value associated with the vehicle or vehicle type in field Weight in box Load information on tab Capacity in the vehicle or vehicle type register. |
|
Load factor |
Indicates the vehicle's load factor in per cent. The fill rate is rounded to a whole percentage. For example, if Opter calculates the fill rate as "62.3%", it will display "62%". |
Average per vehicle and relevant period of time
For example, the table Average per vehicle and relevant period of time may show that a particular vehicle was on average loaded to 70% of its maximum capacity during the time period you have selected.
The columns of the table are described below.
|
Column name |
Description |
|---|---|
|
Vehicles |
Indicates to which Vehicle the information in the row applies. |
|
Weight |
The summed pricing weight from all shipments that fulfil the conditions you specified when creating the statistical report, i.e. period, region, trail, vehicle and the setting of the checkbox Take into account “Affects vehicle load” status. |
|
Load factor |
Indicates the average vehicle load factor during the period. The fill rate is expressed as a percentage. The fill rate is rounded to a whole percentage. For example, if Opter calculates the fill rate as "61.8%", it will display "62%". |
Requirements
For the most accurate statistical report, please check the following:
-
That all vehicles or vehicle types have a value in the field Weight.
Click on Register > Vehicles and the Capacity tab. The Load information box contains the field Weight. The field Weight indicates the maximum weight that the vehicle can carry.
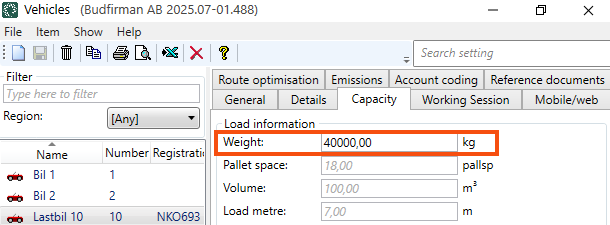
Opter takes information on capacity primarily from the vehicle, and secondarily from the vehicle type.
-
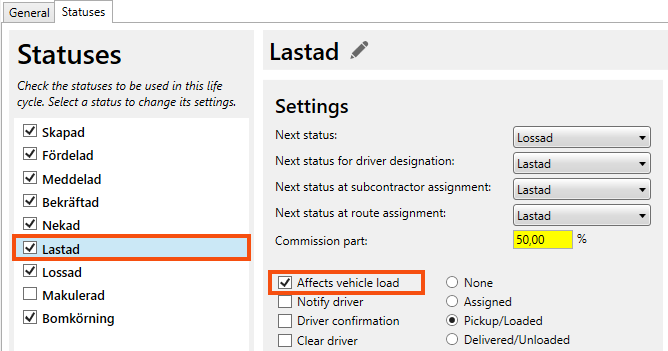
Ensure that the checkbox Affects vehicle load is ticked for the statuses you require.
Click on Settings > Life cycles and statuses > Statuses tab. Select the status (for example Picked up) and check the setting on the checkbox Affects vehicle load.
How the statistics are calculated
Opter totals the pricing weight from the shipments and compares this to the capacity of the vehicle.
The vehicle load factor is calculated using the formula Weight / Capacity (weight) as follows
-
Weight: The summed pricing weight from all shipments that fulfil the conditions you specified when creating the statistical report, i.e. period, region, trail, vehicle and the setting of the checkbox Take into account “Affects vehicle load” status.
-
Capacity (weight): The value of the vehicle or vehicle type in the Weight field in the Load information box on the Capacity tab of the register of vehicles or vehicle types.
Consider the following
Unloaded goods
The function does not take into account that goods may have been unloaded during the journey.
If you take statistics for a specific date, the function calculates the fill rate by totalling the pricing weights from all shipments that:
-
Complies with the conditions you have specified for the statistical report.
-
Already in the vehicle when the day started.
-
Loaded into the vehicle during the day.
The function does not take into account shipments that have been unloaded during the day.
Consignments
The function calculates the fill rate of original orders/original tasks.
Troubleshooting
-
If no statistics are displayed, check the Prerequisites above.
-
The function does not take into account that goods may have been unloaded during the journey.