Statistical reports
Last updated: 14 January 2026
In this article
In Opter you can create a variety of statistical reports that are displayed in table format, and in some cases also in graph format. You can then export these statistical reports to Excel if you want to carry out further work on the information. You can print the graphs or save them in a file outside Opter.
Here are some examples of statistical reports that can be created in Opter:
-
Delivery time accuracy per customer, service or resource owner.
-
Profitability of shipments handled by subcontractors.
-
Packages that have never been scanned.
-
How many days it has taken to process orders (Orders > Handling days).
-
Overview of income and costs.
Statistical reports are based on the order date unless otherwise specified. This allows different statistical reports to be compared with each other. This also means that the statistics may differ from other items. For example, Invoiced orders (under Overview) may have different content than the sales ledger for the corresponding period, as the sales ledger is based on invoice dates.
There is also live statistics, which shows the number of orders received in the last 30 minutes. Live statistics are available under Analysis > Live statistics.
You can also use Opter's statistics API to retrieve statistical data from Opter and then compile the statistics yourself outside of Opter. For more information, see Retrieving statistical data via API.
Creating a statistical report
The way in which the various statistical reports are produced differs slightly from case to case, but after deciding which statistics you want to see, you usually choose the time period and the region, and then any other delimitations, such as a particular customer.
Proceed as follows:
-
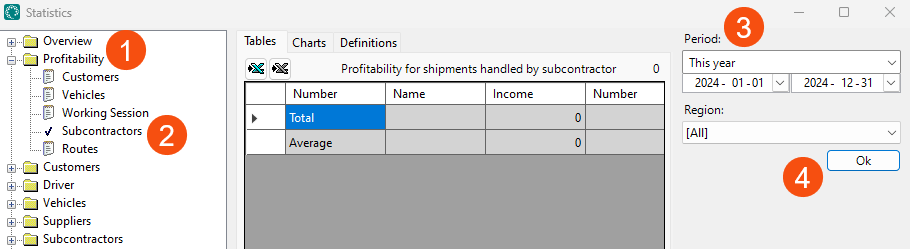
Click on Analysis > Statistics and expand the area for which a statistical report is to be created by clicking on
 , for example Profitability.
 -
Click on the statistical report you want to create, for example Subcontractors.
-
Select the time interval for which statistics are required on the right-hand side of the window.
-
Click on Ok to generate the figures.
The statistical report, the result
View more details
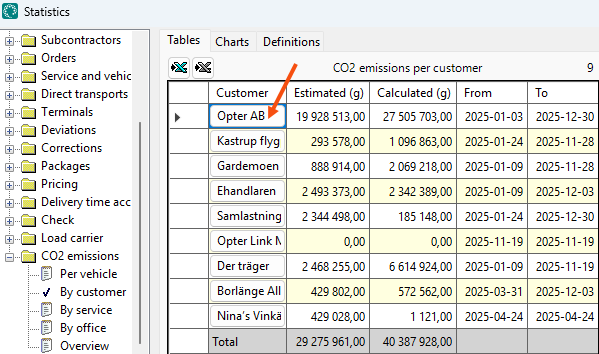
The fields that have an inner frame can be clicked on to see more details. For example, if you want to see more details about a particular customer, click on the customer in the table, see image below.
Scroll sideways
The table displayed may be wider than the window, scroll right to see all the information.
Select a row
To select a row, click on the far left of the row.
Sort
To sort the statistics report in reverse order, click on one of the column headings.
Export statistics
The statistics can be exported to Excel by clicking on ![]() (Export to Excel) or
(Export to Excel) or ![]() (Export to Excel without formatting). If the statistics contain numerous rows, it may take a long time to export the information with formatting, and in some cases it may not be possible to perform the export at all. In such cases, try exporting without formatting.
(Export to Excel without formatting). If the statistics contain numerous rows, it may take a long time to export the information with formatting, and in some cases it may not be possible to perform the export at all. In such cases, try exporting without formatting.

For some statistical reports, the statistics can be shown as a graph on the Charts tab. The graph can be saved as a PNG file by clicking on ![]() . Click on
. Click on ![]() to save it as a PDF or print it.
to save it as a PDF or print it.