Log window (window)
Last updated: 11 May 2026
In this article
![]() Help > Diagnostics > Logs
Help > Diagnostics > Logs
In this log, you can view messages sent between the Opter client and the database, between Opter and PTV, and more. The log can be useful for troubleshooting, for example.
The most recent messages appear at the top of the log. The messages often consist of a question and an answer.
If you click on a row (A) in the log, more detailed information (B) (C) will appear at the bottom of the window. Question (B) is shown on the left and the answer (C) on the right. For example, a query might involve Opter asking PTV for the distance between the sender and the receiver, and PTV replying with the distance; see the image below.
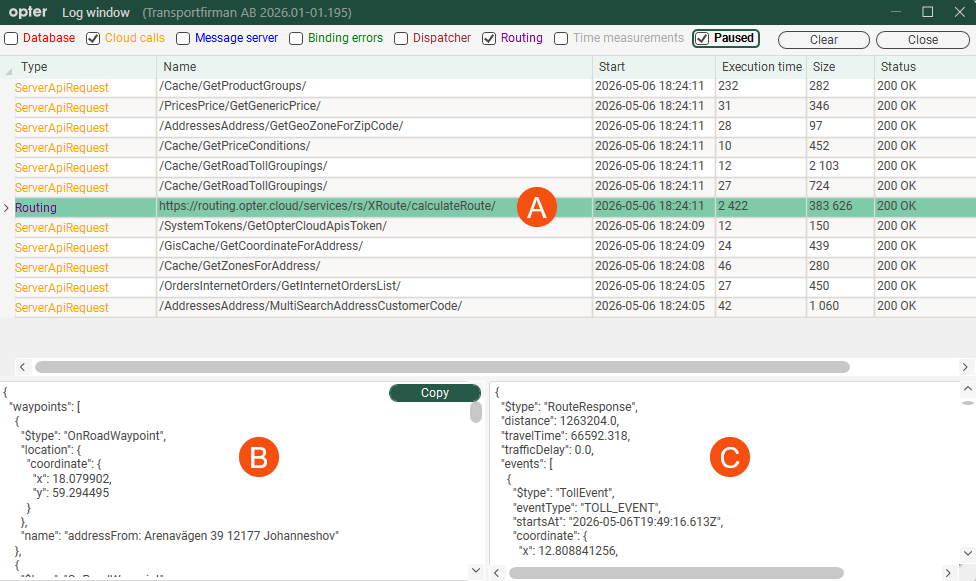
The image shows what the log might look like when the user creates a new order and has just filled in Sender and Receiver in the order reception section, and Opter wants to fill in the distance in the field Distance.
Proceed as follows
-
Click Help > Diagnostics > Logs or press the F11 key when you are in the window Main menu.
The Log window window opens.
-
Tick the boxes next to the logs you want to view:
Function
Description
Database
If you are running an on-premises setup and you want to view messages between the Opter client and the database.
Cloud calls
If you are using Opter Cloud and you want to view the messages exchanged between the Opter client and the database.
Message server
If you want to view messages between the Opter client and the message server.
Binding errors
If you want to check for any data-binding errors.
Dispatcher
If you want to see when Opter creates parallel threads.
Routing
If you want to view messages between Opter and PTV.
Time measurements
Specifically regarding order reception, if you want to see what takes time when, for example, an order is saved. For example, if it takes 10 seconds to save an order, you can see which step is taking the time.
Message logging starts immediately when you tick a box.
-
Logging is now active, so you can, for example, perform an action in Opter (such as creating a new order or assigning a shipment to a resource) and then view the log.
-
If there are a lot of messages in the log and you want to pause it to look at what you’ve already received, tick the box Paused.
If you want to clear the log, press the button Clear.
-
When you're ready, click Close to close the window.
The columns in the log
Function | Description |
|---|---|
Type | Shows the type of message, for example Routing (which refers to messages between Opter and PTV). The different types of messages are displayed in different colours. Messages of types Database, Cloud calls and Routing display both incoming and outgoing messages on the same line in the log. |
Name | Displays the message name or an HTTPS address, for example. |
Start | The date and time when the message was sent, for example, when the question was posted. |
Execution time | The time taken to execute the command, in milliseconds. |
Size | The size of the message in bytes. |
Status | Displays an HTTP status code indicating the outcome of the request. For example, "200 OK" means that the request was successful. The server received the request, understood it, processed it and returned a response containing the requested information. |
Error | This column is not in use and the information it contains is not relevant. |
Pause the log
If there are a lot of messages in the log and you want to pause it to look at what you’ve already received, tick the box Paused.
As long as the checkbox Paused is ticked, no new messages will appear in the log.
Clear the log
Click the Clear button at the top right of the window.